- CSCO -0.39%
Search results
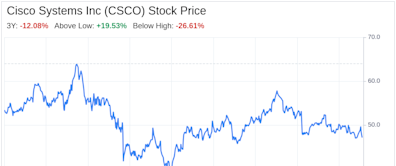
- 46.42Add to watchlist-0.18 (-0.39%)At close: Fri. May 24, 2024 4:00 PM EDT · Nasdaq Real Time Price (USD) · Market closed
- Open46.63High46.79Low46.38
- Mkt Cap187.02BP/E (TTM)15.68Div & Yield1.60 & 3.45%
- Prev. Close46.6052 Wk. Low46.2052 Wk. High58.19
What analysts are sayingTop storiesCisco Systems, Inc. (CSCO) is Attracting Investor Attention: Here is What You Should KnowYahoo Finance · 22 hours ago- CSCO -0.39%
Decoding Cisco Systems Inc (CSCO): A Strategic SWOT InsightYahoo Finance · 3 days ago- CSCO -0.39%
Investing in Cisco (CSCO)? Don't Miss Assessing Its International Revenue TrendsYahoo Finance · 5 days agoRelated stocks
View the latest Cisco Systems Inc. (CSCO) stock price, news, historical charts, analyst ratings and financial information from WSJ.
5 days ago · 46.20 58.19. Day Range. 47.01 48.07. EPS (FWD) 3.70. PE (FWD) 13.00. Div Rate (FWD) $1.60. Yield (FWD) 3.32% Market Cap. $195.05B. Volume. 22,031,066. Prev. Close. $48.17. CSCO Analysis. Cisco:...
Nasdaq. 16,801.54. –0.18% US 10 Yr. 4.42. 0.00% FTSE 100. 8,370.33. –0.55% Crude Oil. 77.16. –0.53% Gold. 2,406.90. –0.36% Euro. 1.08. +0.04% Pound/Dollar. 1.27. +0.03% Markets. Data. Cisco Systems...
View the latest Cisco Systems Inc. (CSCO) stock price, news, historical charts, analyst ratings and financial information from WSJ.
NASDAQ: CSCO. Price. 48.06. Change. + 0.27. Volume. 12,094,931. % Change. + 0.56% Intraday High. 48.10. 52 Week High. 58.19. Intraday Low. 47.70. 52 Week Low. 45.70. Today's Open. 48.00. Previous Close. 47.79. May 10, 2024 4:00 PM. 20 minutes minimum delay. Stock chart.
3 days ago · Cisco-stock. Cisco Inc. Stock , CSCO. 47.05 +0.11 +0.23% After-market. 06:42:26 PM EDT 5/21/2024. BTT. Add to watchlist. 46.94 -0.20 -0.41% Official Close 03:59:59 PM EDT 5/21/2024 BTT....
48.34 -1.33 (-2.68%) At close: 04:00PM EDT. 48.48 +0.14 (+0.29%) After hours: 07:32PM EDT. 1d. 5d. 1m. 6m. YTD. 1y. 5y. Max. Full screen. Trade prices are not sourced from all markets. All. News....


