Search results
- 5.21Add to watchlist-0.13 (-2.43%)At close:4:01 PM EDTTue. Jun 4, 20245.24 +0.03 (+0.58%)After hrs:6:48 PM EDTTue. Jun 4, 2024Nasdaq Real Time Price (USD) · Market closed
- Open5.31High5.37Low5.20
- Mkt Cap11.09BP/E (TTM)N/ADiv & YieldN/A & N/A
- Prev. Close5.3452 Wk. Low3.6152 Wk. High16.18
What analysts are sayingTop storiesBest China Stocks: Tesla Rival Leads Five Stocks Near Buy PointsInvestor's Business Daily · 1 day agoHere is What to Know Beyond Why NIO Inc. (NIO) is a Trending StockYahoo Finance · 2 weeks agoRelated stocks
NIO Inc. (NIO) NYSE - Nasdaq Real Time Price. Currency in USD. Loading interactive chart... © 2024 Yahoo. All rights reserved. In partnership with ChartIQ. At Yahoo Finance, you get free...
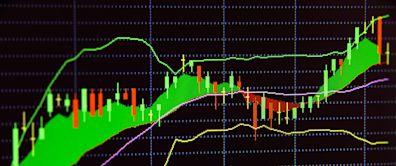
0.8073. +3.12%. Interactive Chart for NIO Inc. (NIO), analyze all the data with a huge range of indicators.
Open 5.27. Bid 5.40 x 38800. Ask 5.44 x 40000. Day's Range 5.26 - 5.52. 52 Week Range 3.61 - 16.18. Volume 60,525,399. Avg. Volume 56,909,595. Market Cap (intraday) 11.25B. Beta (5Y Monthly) 1.91....
NYSE: NIO · IEX Real-Time Price · USD. 5.39. -0.01 (-0.19%) At close: May 31, 2024, 4:02 PM. 5.53. +0.14 (2.60%) Pre-market: Jun 3, 2024, 8:49 AM EDT. Overview. Financials. Statistics. Forecast. Dividends. Profile. Chart. 1D. 5D. 1M. YTD. 1Y. 5Y. Max. No 1Y chart data available. News. All. Videos. Press Releases. Conversation.
- 6.21B
- 7.84B
- 2.98B
- 1.55B
Today's High. Today's Low. 52 Week High. 52 Week Low. Stock Chart. Data Provided by Refinitiv. Minimum 15 minutes delayed. chart showing pricing data with tools to compare and analyze data.
People also ask
Is NIO on the watchlist NYSE?
How much does Nio EV cost?
Is $Nio stock a 'zone of despair'?
What makes NiO different?
4 days ago · Daily market news in bullet point format. Interactive stock price chart for NIO Inc. (NIO) with real-time updates, full price history, technical analysis and more.


