

1996
Search results
Fishbone is an American rock band from Los Angeles, California. Formed in 1979, the band plays a fusion of ska, punk, funk, metal, reggae, and soul. AllMusic has described the group as "one of the most distinctive and eclectic alternative rock bands of the late '80s.
The fishbone diagram identifies many possible causes for an effect or problem. It can be used to structure a brainstorming session. It immediately sorts ideas into useful categories.
Get updates on new shows, new music, and more. follow. Upcoming | Past | Near Me. Sunday, October 6th, 2024. San Pedro, CA. Berth 46. Notify Me.
Jan 2, 2023 · A fishbone diagram is a problem-solving approach that uses a fish-shaped diagram to model possible root causes of problems and troubleshoot possible solutions. It is also called an Ishikawa diagram, after its creator, Kaoru Ishikawa, as well as a herringbone diagram or cause-and-effect diagram.
What is a Fishbone Diagram? The Fishbone Diagram is a graphical tool used for identifying and organizing possible causes of a specific problem or outcome. The diagram resembles the skeletal structure of a fish, hence its name.
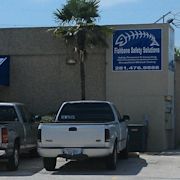
Founded in 2015, Fishbone Seafood Restaurant has been regarded as one of the top ten busiest seafood restaurants in Southern California. Their wide menu of southern styled fried and grilled seafood, po’ boys sandwiches, and salads have garnered them a dedicated customer base who are consistently begging for more locations!
Jul 24, 2023 · A Fishbone diagram, also known as an Ishikawa diagram, is defined as a powerful causal analysis tool designed to uncover the root causes of complex problems. Learn more with categories, examples, types, and best practices.
A fishbone diagram is a powerful problem-solving tool used in healthcare, engineering, and many other industries. Find out how you can use Lucidchart, Visio, and Excel to construct a fishbone diagram. Check out Lucidchart's free fishbone diagram examples and templates.
Mar 6, 2024 · The Fishbone Diagram is a visual tool used in Lean Six Sigma to identify root causes of problems. It resembles a fish skeleton, with the main problem at the head and potential causes branching off the spine into categories, facilitating a systematic approach to problem-solving.
Upcoming tour dates, show archive, live recordings,... Since 2003, Fishbonelive.org has been fed by the community with thousands of show pictures, reviews, setlists,... making it the best place to remember and plan all your Fishbone shows.
Related searches