Search results
The Drought Monitor summary map identifies general areas of drought and labels them by intensity. D1 is the least intense level and D4 the most intense. Drought is defined as a moisture deficit bad enough to have social, environmental or economic effects.
The U.S. Drought Monitor is a weekly assessment of the extent and severity of drought in the United States. It’s a map released every Thursday, showing parts of the U.S. that are in drought, based on various sources of data collected through the previous week.
- WCNC Charlotte
Drought Monitor Map covers North Carolina 100% for the first time since 2009
For the first time since 2009, the entire state of North Carolina is officially in a drought. Every Thursday, the U.S. Drought Monitor issues a map that updates the drought status for each state ...
7 days ago
- WJZY via Yahoo
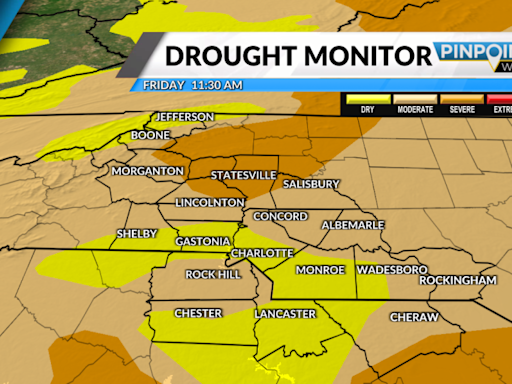
Drought Monitor Map: Several local NC counties under ‘Severe Drought’ conditions
DMAC expanded the severe drought classification to 22 counties, and the moderate drought classification to 71 counties. Parts of six counties were classified as 'abnormally dry.'
6 days ago
The U.S. Drought Monitor is updated each Thursday to show the location and intensity of drought across the country, which uses a five-category system, from Abnormally Dry (D0) conditions to Exceptional Drought (D4).
The Map Viewer allows users to view Drought Monitor data—from both the current and past weeks of the map—in an interactive interface containing various map layers.
Interact with map layers related to drought and precipitation. U.S. Drought Monitor Map. A weekly map—updated each Thursday—that shows the location and intensity of areas currently experiencing abnormal dryness or drought across the United States.
Jul 3, 2024 · The U.S. Drought Monitor 1-week change map shows where drought has improved, remained the same, or worsened since the previous week's Drought Monitor. Yellow/orange hues show areas where drought worsened, while green hues show drought improvement.
USDM Drought Change Maps display changes in drought class degradation and drought class improvements across the United States. USDM offers Drought Change Maps at weekly, monthly and annual timescales.
The U.S. Drought Monitor, established in 1999, is a weekly map of drought conditions that is produced jointly by the National Oceanic and Atmospheric Administration, the U.S. Department of Agriculture, and the National Drought Mitigation Center (NDMC) at the University of Nebraska-Lincoln.
The United States Drought Monitor (USDM) serves as initial conditions for the CPC’s drought outlooks. Due to the 7-16 day time span between releases of the Seasonal Drought Outlook (SDO) on the third Thursday of each month and Monthly Drought Outlook (MDO) on the last day of each month, large changes may occur in the USDM.
The U.S. Drought Monitor is a map released every Thursday showing parts of the U.S. and its territories that are in drought. The map uses five classifications: abnormally dry (D0), showing areas that may be going into or are coming out of drought, and four levels of drought ranging from moderate (D1), severe (D2), extreme (D3), to exceptional (D4).

