- AVGO +0.35%
Ad
related to: AVGOUsing their trading system, Zack's experts give you their prediction for AVGO in free RPT. Broadcom's new earnings have just been released, discover why they're capturing attention
Search results
- 1,337.51Add to watchlist+4.71 (+0.35%)At close:4:00 PM EDTMon. May 13, 20241,337.24 -0.27 (-0.02%)After hrs:7:02 PM EDTMon. May 13, 2024Nasdaq Real Time Price (USD) · Market closed
- Open1,348.00High1,358.38Low1,330.11
- Mkt Cap619.83BP/E (TTM)49.68Div & Yield21.00 & 1.58%
- Prev. Close1,332.8052 Wk. Low628.4752 Wk. High1,438.17
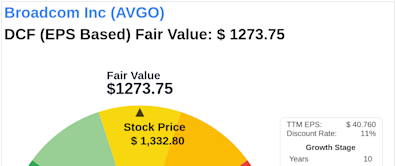
What analysts are sayingTop storiesBeyond Market Price: Uncovering Broadcom Inc's Intrinsic ValueYahoo Finance · 11 hours ago- AVGO +0.35%
Broadcom Inc. (AVGO) Is a Trending Stock: Facts to Know Before Betting on ItYahoo Finance · 6 days agoDow Jones Futures Rise But Inflation Data Looms; Taiwan Semiconductor In Buy ZoneInvestor's Business Daily · 12 hours agoRelated stocks
5 days ago · Stock analysis for Broadcom Inc (AVGO:NASDAQ GS) including stock price, stock chart, company news, key statistics, fundamentals and company profile.
- 20K
23 hours ago · Broadcom Inc. (AVGO Quick Quote AVGO - Free Report) ended the recent trading session at $1,337.51, demonstrating a +0.35% swing from the preceding day's closing price. This change outpaced the S&P ...
People also ask
Is Broadcom (Avgo) a good stock to buy?
What are Avgo share price targets?
Should you buy Avgo stock?
Does Broadcom (Avgo) have a downside?
4 days ago · Their AVGO share price targets range from $44.00 to $1,720.00. On average, they expect the company's share price to reach $1,285.41 in the next twelve months. This suggests that the stock has a possible downside of 1.6%. View analysts price targets for AVGO or view top-rated stocks among Wall Street analysts.
- (408) 433-8000
- 1320 RIDDER PARK DRIVE, SAN JOSE CA, 95131
- investor.relations@broadcom.com
5 days ago · Broadcom Inc. Common Stock ( AVGO ) Bid: $1,316.38 X 1. Ask: $1,320.00 X 4. Volume: 1,390,524. 52 Week Range: 615.86 - 1,438.17. High/Low: 1,288.49 - 1,337.61. AVGO. Pre-Market. Broadcom Inc....
5 days ago · View Broadcom Inc. AVGO stock quote prices, financial information, real-time forecasts, and company news from CNN.
4 days ago · AVGO Price. $1,325.37. Fair Value Price. $906.44. Market Cap. $614.20B. 52 Week Low. $617.99. 52 Week High. $1,438.17. P/E. 47.66x. P/B. 8.74x. P/S. 14.24x. PEG. 1.4x. Dividend Yield. 1.49% Revenue. $38.87B. Earnings. $11.63B. Gross Margin. 67.1% Operating Margin. 38.06% Profit Margin. 29.9% Debt to Equity. 1.53. Operating Cash Flow.


